
How it works
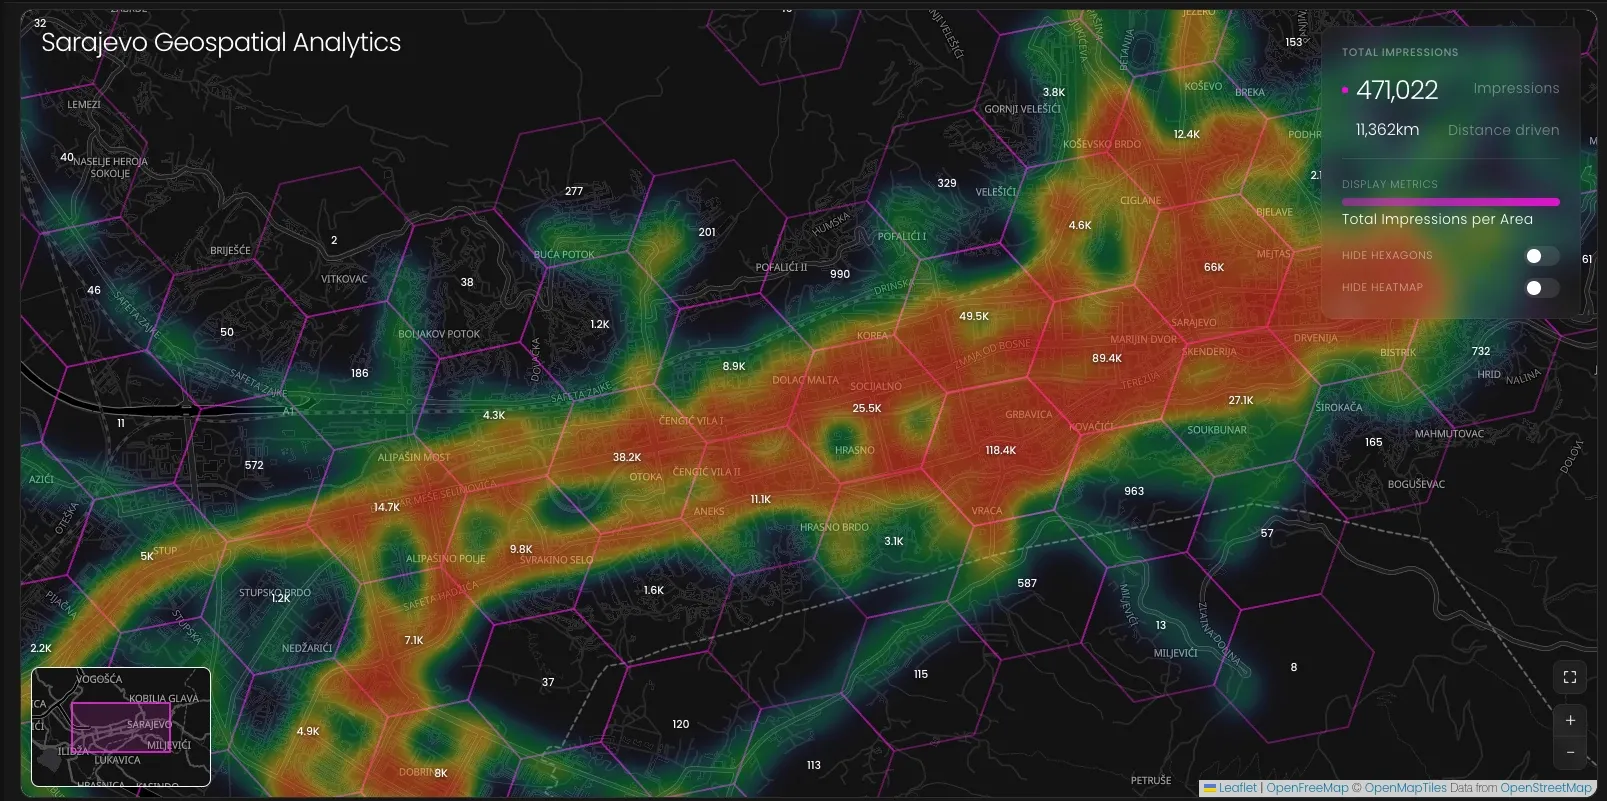
From city streets to your dashboard
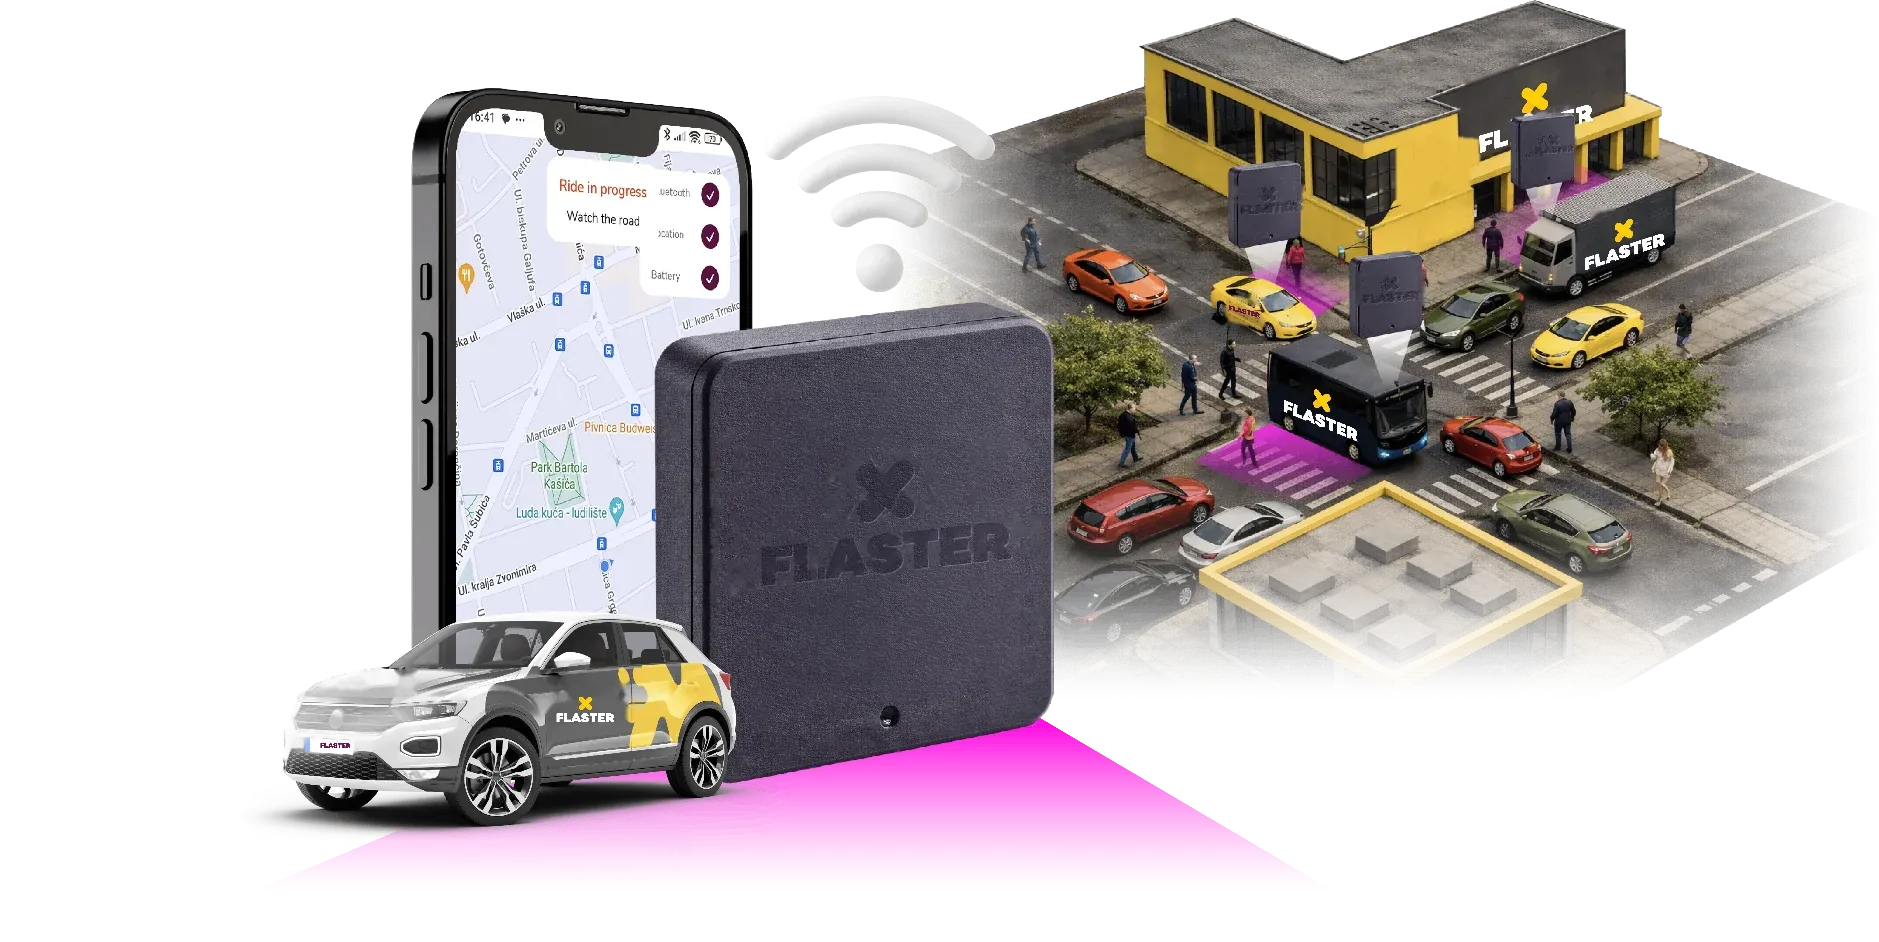
A device in every vehicle
We fit it when we brand the vehicle. The driver doesn't have to do anything.
It picks up anonymised signals
It counts contacts from nearby devices and never identifies anyone.
Contacts turn into impressions
You see them in the dashboard while the campaign runs.
Dashboard tour
What you see in the dashboard
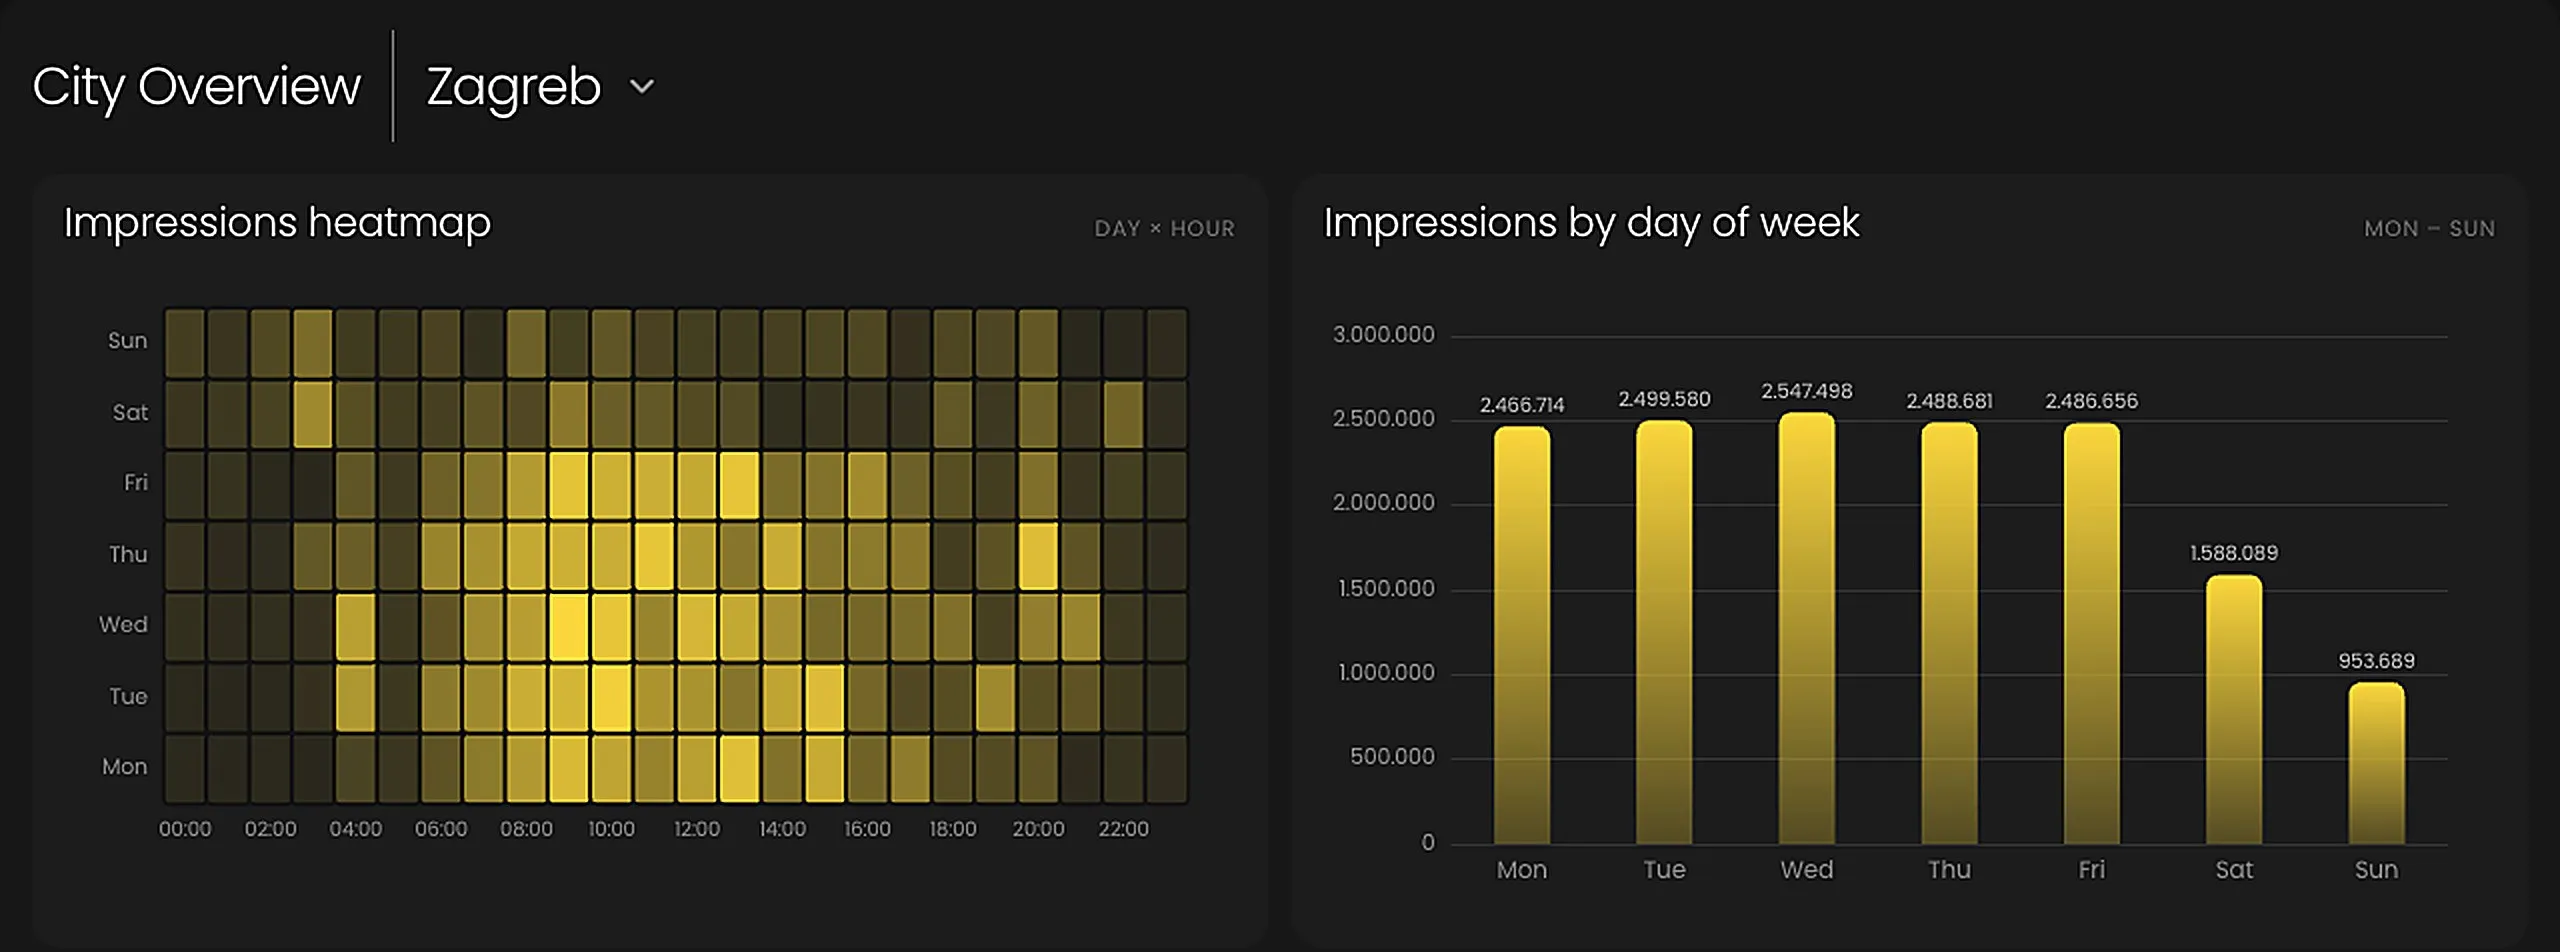
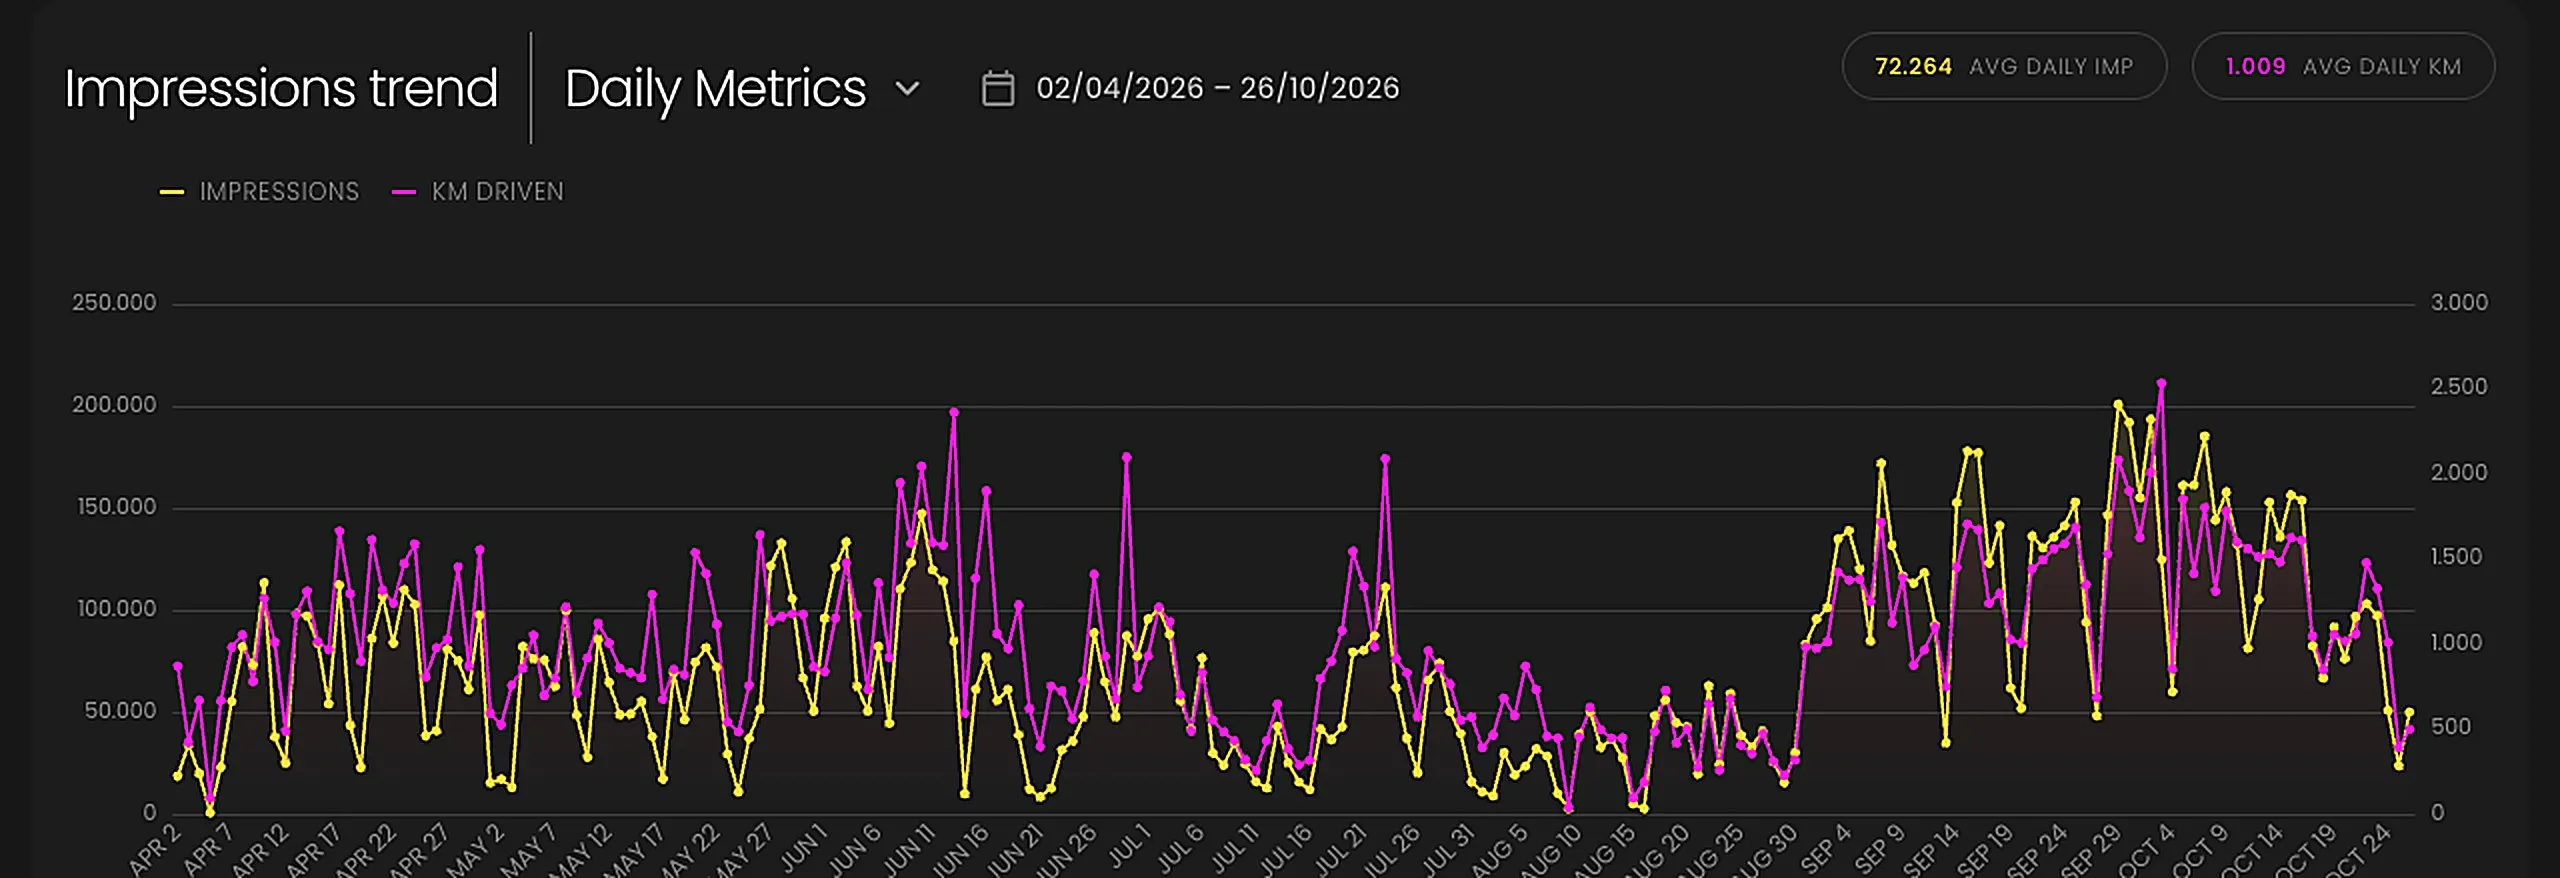
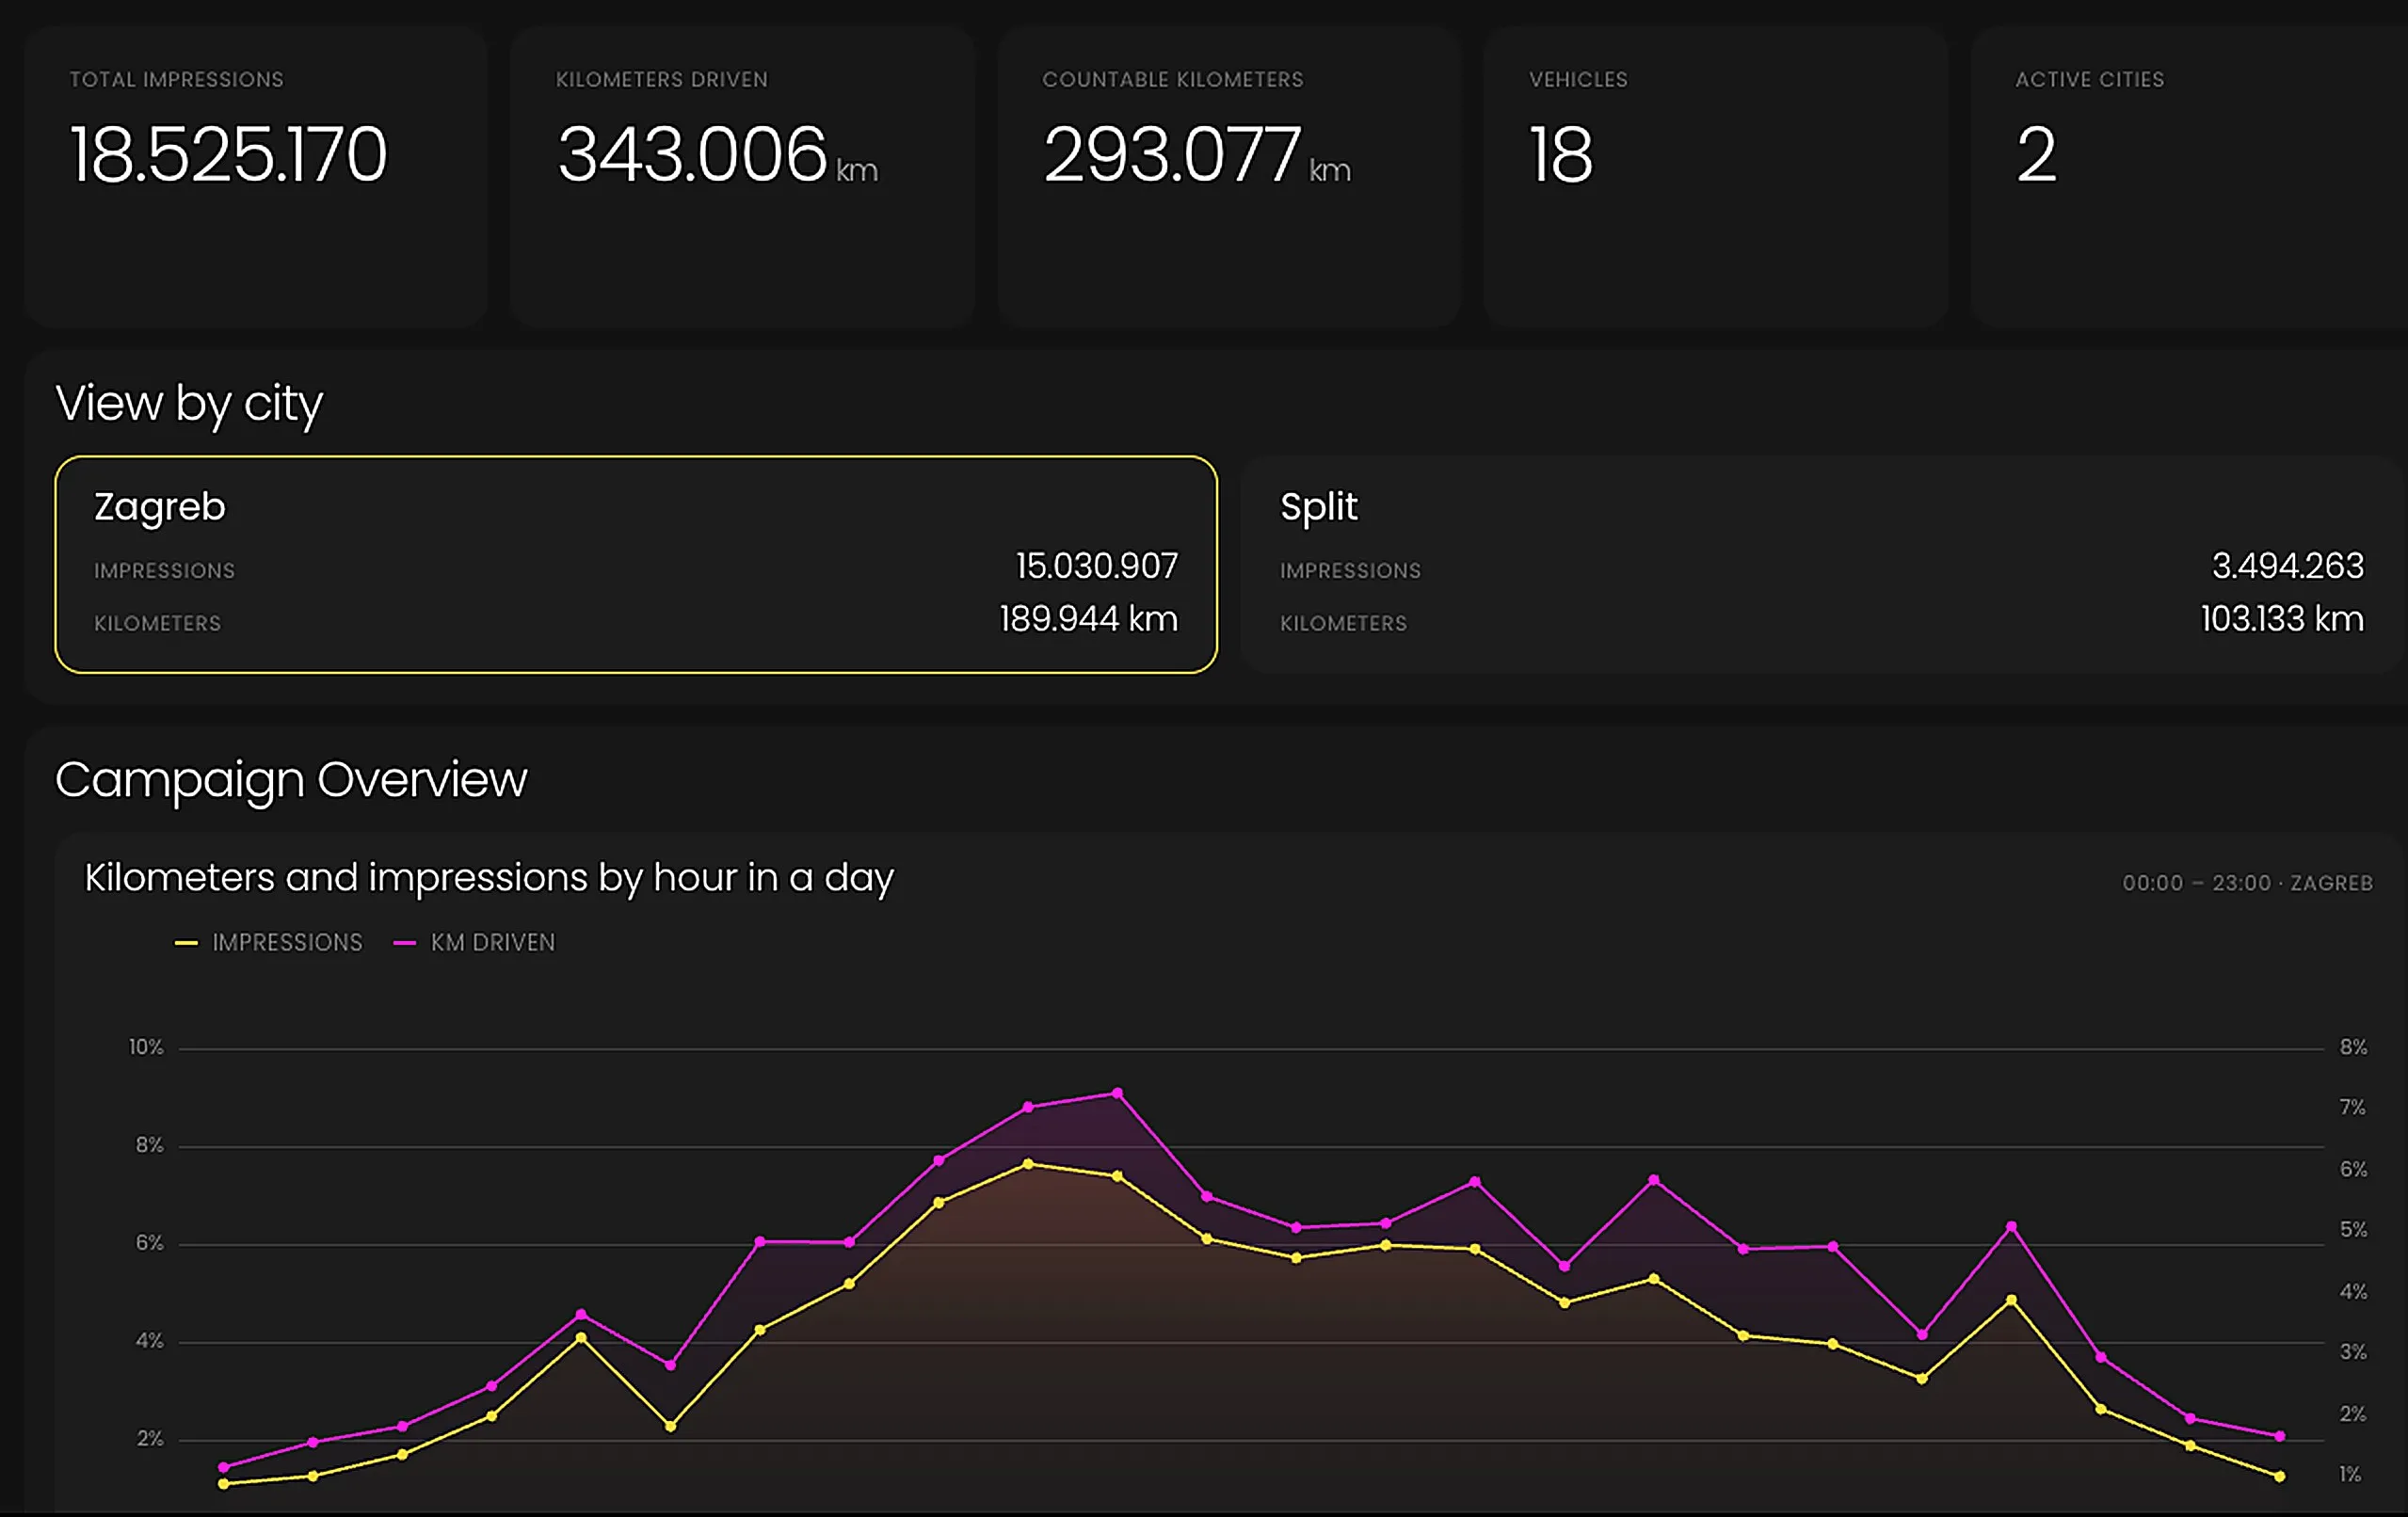
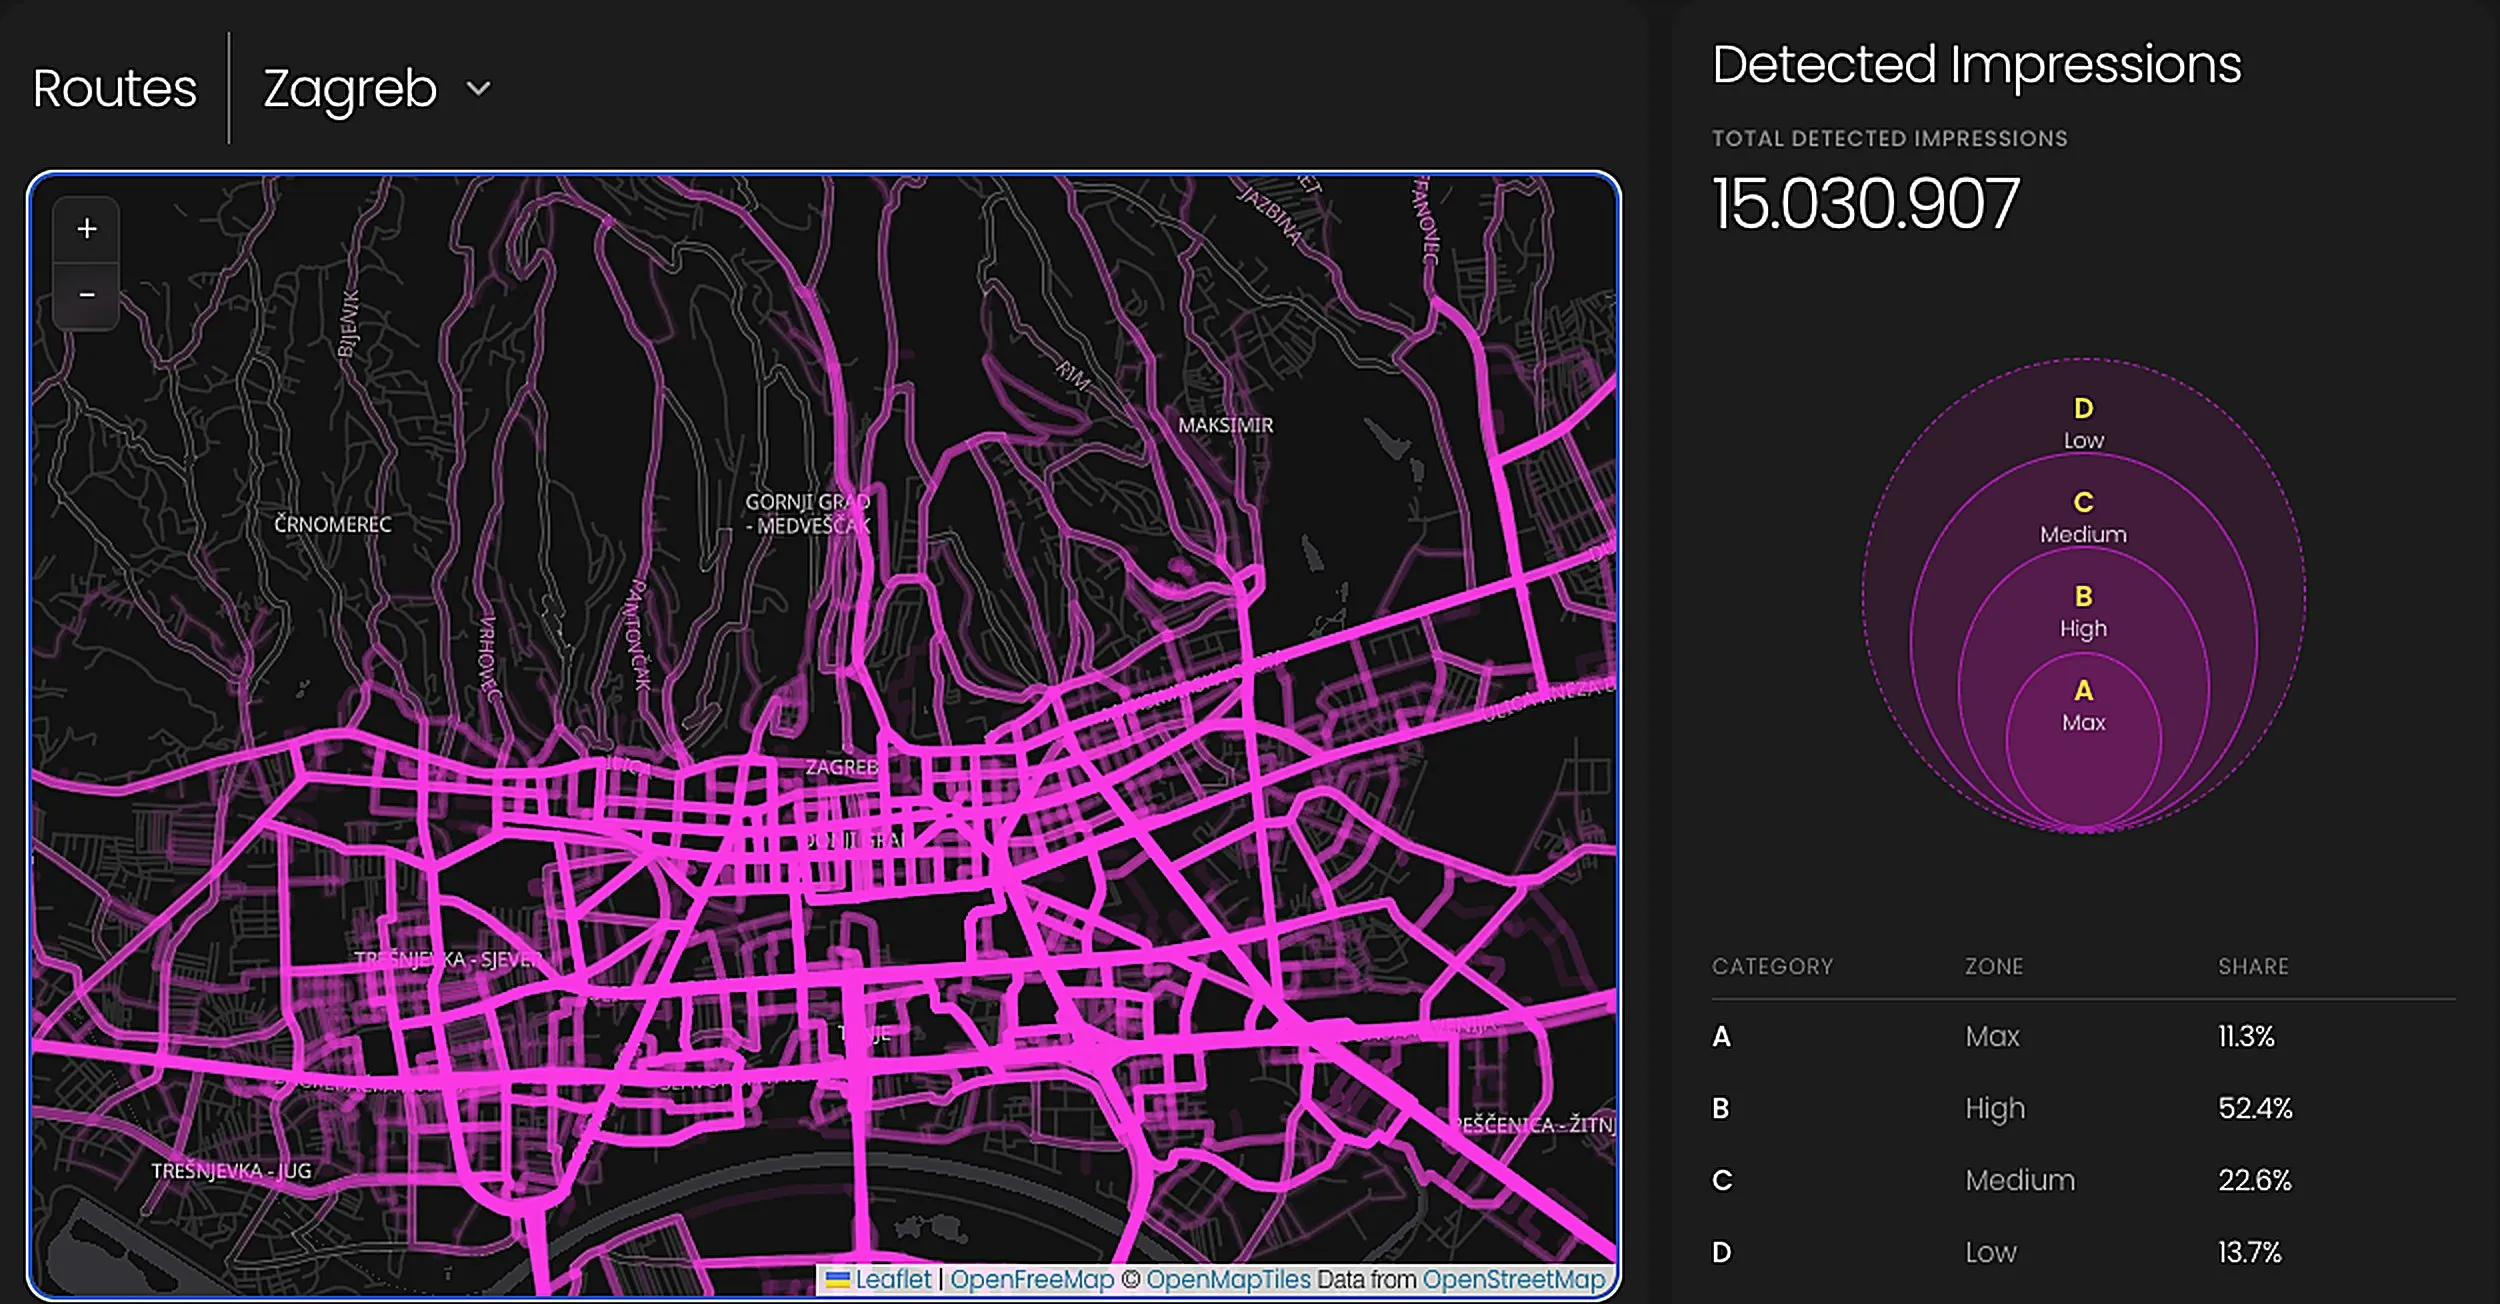
AI summaryPhilips OneBlade · Zagreb, Croatia · 28 daysupdated today at 07:00
Over 28 days, 14 vehicles drove 76,465 km and delivered 1,698,562 impressions, an average of 60,663 a day. Passengers also took home 5,838 brochures.
What stands out
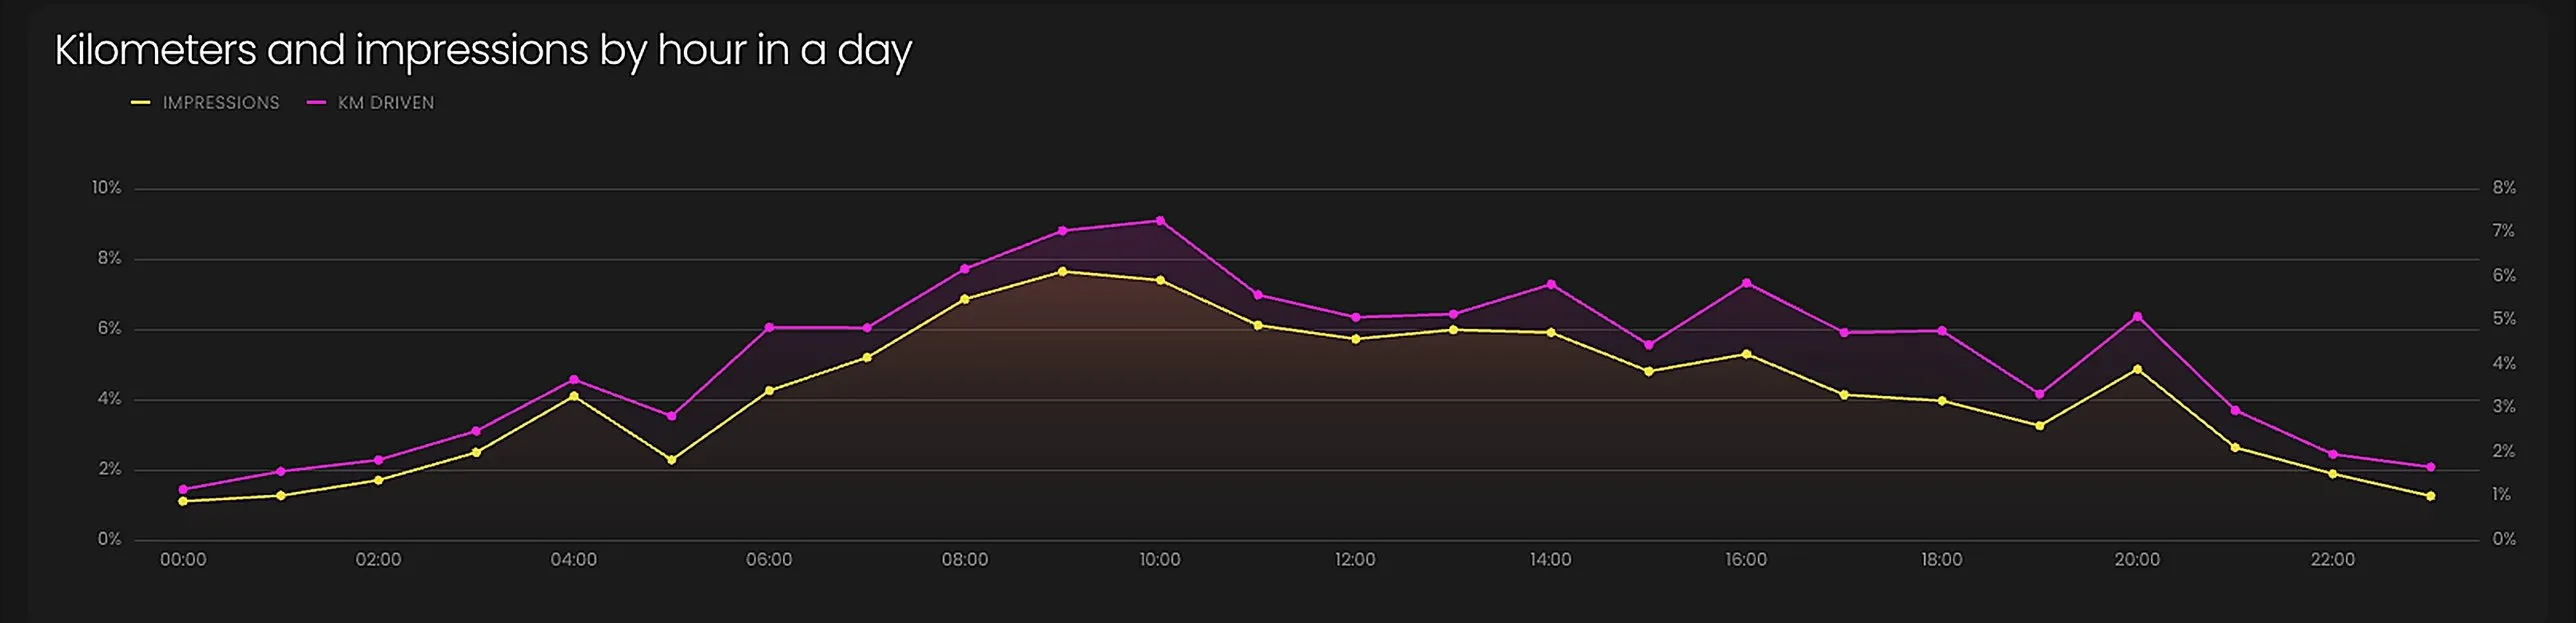
- Reach peaks on Fridays and between 5 and 6 pm, when traffic is heaviest.
- Reach is about 20% lower at weekends because the vehicles drive less.
- The city centre and the area around the main station bring the most impressions.
Suggestion for next week
- On match days, send the vehicles towards the fan zones between 5 and 9 pm.
- Brochures go fastest on afternoon rides, so it's worth offering them more then.
The summary is written by AI from the campaign data, and you can check every figure in the other tabs.
Privacy
We count contacts and never identify anyone
The device turns anonymised signals into impressions. It never identifies or follows anyone.